

东营河口贝类增养殖区位于渤海湾南岸黄河三角洲近岸海域,是我国主要的滩涂贝类生产区。但是,随着区域经济和城镇化的发展,近岸海域水质出现富营养化[1]。2009年东营河口贝类增养殖区被划定为东营市河口浅海贝类生态国家级海洋特别保护区的“环境整治区”,采取多种综合治理措施进行海域生态环境保护和修复。目前,有关渤海海域水环境的研究包括渤海海域营养盐时空分布[2-3]、水体富营养评价[4]、营养盐变化及发展趋势分析[5-6]等,研究热点区域包括莱州湾[7]、辽东湾[8]及黄河口海域[9]。《2020年中国海洋生态环境状况公报》指出,我国近岸海域主要超标物质为无机氮(DIN)和磷酸盐(PO4-P),其中辽东湾和黄河口近岸海域出现劣四类海水。为此,有必要对东营河口贝类增养殖区的水质进行监测与评价。
本研究在2020—2021年对东营河口贝类增养殖区海域进行了4个航次的调查,对海水水温、pH、盐度、溶解氧(DO)、化学需氧量(COD)、氨态氮(NH3-N)、亚硝酸态氮(NO2-N)、硝酸态氮(NO3-N)和无机磷(DIP)进行监测,并采用内梅罗环境质量综合评价指数(P)、营养状态指数(E)以及有机污染评价指数(A)对其水环境质量状况进行评价,旨在为该区的贝类养殖和环境保护提供基础数据。
1 材料与方法
1.1 站位布设
如图1所示,根据东营河口区附近的贝类养殖区的分布状况,本次调查在滩涂和浅海区域各设置了3个平行调查站位。其中T1、T2和T3站点位于滩涂区(涨潮时水深1.0~1.5 m);Q1、Q2和Q3站点位于浅海区(水深7~14 m)。
图1
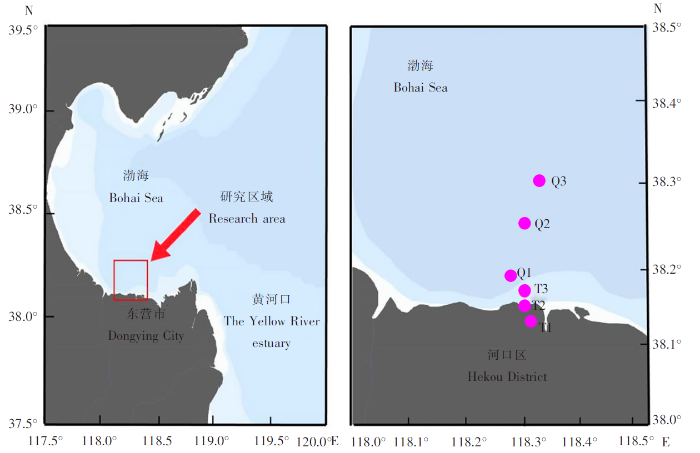
图1
东营河口贝类增养殖区海域监测站位
Fig.1
Monitoring stations in the shellfish culturing areas of Dongying River estuary
1.2 采样与检测方法
本研究分别于2020年12月和2021年3月、6月、10月进行了4个航次的调查,均在大潮日的高潮时进行采样。每批次样品的采集均在同一个高潮时内完成。利用多参数水质分析仪(YSI)对水温、pH和DO进行了现场测定。另取水样低温冷藏带回实验室,按照《海洋监测规范》方法对水样的盐度、NO3-N、NO2-N、NH3-N、DIP和COD等理化指标进行测定与分析。每个水样均重复测定3次,取其平均值进行比较分析和数理统计。
1.3 评价方法
1.3.1 水质综合评价
采用单因子评价指数法、内梅罗环境质量综合评价指数法对河口贝类增养殖区水质状况进行分析评价,计算公式如下所示:
式(1)为单因子评价指数计算公式,其中:Pi为某污染因子的污染指数;Ci为第i项污染物的监测值;Si为第i项污染物海水水质二类标准评价值;评价指数Pi>1,表明该水质参数超过了规定的水质标准,已经不能满足使用功能的要求。式(2)为内梅罗环境综合指数计算公式,P为内梅罗综合指数;Pmax为所测污染指标中最大的污染指数值。
如表1所示,根据内梅罗环境质量综合评价指数(Nemero environmental composite quality index,P)评价标准对养殖区的水质进行综合的分析和评价。
| 内梅罗环境 质量综合 评价指数(P) | 等级 Grade | 质量状况 Quality status | 类别 Category | 污染状况 Pollution status |
|---|---|---|---|---|
| <0.50 | 1 | 良好 | 1 | 清洁 |
| 0.50~0.75 | 2 | 较好 | 2 | 较清洁 |
| 0.75~1.00 | 3 | 一般 | 2 | 轻度污染 |
| 1.00~1.25 | 4 | 较差 | 2 | 中度污染 |
| 1.25~1.50 | 5 | 差 | 3 | 重度污染 |
| >1.50 | 6 | 很差 | 3 | 严重污染 |
1.3.2 营养水平评价
营养状态指数法(Trophic state index,E)[11]是目前常用于我国近岸海域富营养化评价的方法之一,该方法以海域环境状况为依据,计算公式如下:
式(3)中:COD、DIN和DIP分别为水样中化学需氧量、无机三氮(NH3-N、NO2-N、NO3-N)和无机磷的实测浓度(mg/L)。营养指数(E)≥1表示水体呈富营养化状态,E<1则表示水质正常。
1.3.3 有机污染评价
有机污染评价指数法(Organic pollution assessment index,A)根据DO、COD、DIN和DIP等4项指标的污染指数来判断水质状况,综合考虑了海水的有机污染和无机污染指标,因此其能综合反映海水水质的整体状况[12]。计算公式如下:
式(4)中,COD、DIN和DIP分别为水体中各自的实测数据,CODB、DINB和DIPB分别为水体中COD、DIN和DIP的评价标准。根据A值将海水污染水平分为6级:A<0为水质良好;0≤A<1为水质较好;1≤A<2为开始受到污染;2≤A<3为轻度污染;3≤A<4为中度污染;A≥4为严重污染。
2 水质监测与评价
2.1 河口贝类增养殖区水质的季节变化
2.1.1 环境因子的季节变化
河口贝类增养殖区海水的温度、盐度、pH、DO和COD的变化如表2所示。养殖区海域表层海水平均水温随着季节的变化而变化,变化范围为1.40~27.90℃;盐度呈明显的季节性变化但差距不大,6月和12月的盐度相对较高,3月和10月的盐度较低,变化范围为25.00~35.50;pH基本随水温的升高而降低,在一定范围内波动,pH变化范围为7.46~8.68,波动范围不明显。本次调查测得河口贝类增养殖区的DO为5.33~13.54 mg/L,其中10月DO值最高,6月最低。COD为0.56~2.49 mg/L,在12月、3月以及6月3个调查航次中表现为浓度较低且变化平稳,而在10月骤然升高。
表2 东营河口贝类增养殖区常规水质的变化
Tab.2
| 年-月 Year-month | 温度/℃ Water temperature | 盐度 Salinity | pH | 溶解氧/(mg/L) DO | 化学需氧量/ (mg/L) COD | |||||
|---|---|---|---|---|---|---|---|---|---|---|
| 范围 Range | 均值 Mean | 范围 Range | 均值 Mean | 范围 Range | 均值 Mean | 范围 Range | 均值 Mean | 范围 Range | 均值 Mean | |
| 2020-12 | 1.40~ 6.90 | 3.95 | 34.80~ 35.50 | 34.96 | 8.25~ 8.67 | 8.48 | 10.73~ 14.50 | 12.24 | 0.43~ 0.82 | 0.56 |
| 2021-03 | 7.60~ 12.70 | 10.95 | 30.00~ 35.00 | 30.83 | 8.13~ 8.68 | 8.47 | 8.76~ 13.20 | 10.35 | 0.10~ 1.85 | 0.76 |
| 2021-06 | 24.40~ 27.90 | 25.63 | 31.20~ 34.00 | 32.50 | 7.46~ 8.08 | 7.93 | 5.07~ 5.59 | 5.33 | 0.31~ 1.43 | 0.70 |
| 2021-10 | 15.40~ 16.40 | 16.07 | 25.00~ 33.50 | 29.90 | 7.85~ 8.56 | 8.34 | 12.81~ 14.13 | 13.54 | 1.08~ 4.84 | 2.49 |
2.1.2 营养盐的季节变化
东营河口贝类增养殖区主要营养盐监测结果见表3,增养殖区DIN及其组分NH3-N、NO2-N和NO3-N的浓度分别为0.006~0.726、0.003~0.139、0.001~0.163、0.002~2.490 mg/L。增养殖区NH3-N的浓度为0.003~0.139 mg/L,表现为10月最高、其他月份浓度相近的特征。本次调查NO2-N的浓度范围为 0.001~0.163 mg/L,表现为10月最高、6月次之、3月和6月最低的季节特征。NO3-N 和 DIN 浓度表现为10月最高、12月和3月次之、6月最低的季节特征。增养殖区DIP浓度在4次调查中均处于较低水平,浓度为0.001~0.010 mg/L。从平均浓度看,增养殖区的DIP符合海水一类标准,同时,增养殖区的NH3-N和DIN在12月、3月以及6月的浓度均符合海水一类标准,但在10月二者均出现超标现象。
表3 东营河口贝类增养殖区主要营养盐的变化
Tab.3
| 年-月 Year-month | NH3-N | NO2-N | NO3-N | DIN | DIP | |||||
|---|---|---|---|---|---|---|---|---|---|---|
| 范围 Range | 均值 Mean | 范围 Range | 均值 Mean | 范围 Range | 均值 Mean | 范围 Range | 均值 Mean | 范围 Range | 均值 Mean | |
| 2020-12 | 0.009~ 0.018 | 0.014 | 0.001~ 0.010 | 0.004 | 0.030~ 0.180 | 0.097 | 0.015~ 0.054 | 0.034 | 0.001~ 0.003 | 0.002 |
| 2021-03 | 0.003~ 0.010 | 0.007 | 0.003~ 0.007 | 0.005 | 0.200~ 0.460 | 0.351 | 0.053~ 0.176 | 0.087 | 0.000 5~ 0.001 | 0.001 |
| 2021-06 | 0.005~ 0.047 | 0.017 | 0.002~ 0.022 | 0.009 | 0.002~ 0.036 | 0.025 | 0.006~ 0.046 | 0.022 | 0.001~ 0.010 | 0.006 |
| 2021-10 | 0.025~ 0.139 | 0.096 | 0.061~ 0.163 | 0.107 | 1.410~ 2.490 | 1.814 | 0.371~ 0.726 | 0.521 | 0.000 5~ 0.001 | 0.001 |
2.2 水质综合评价
2.2.1 水质综合评价
河口贝类增养殖区中各评价因子污染指数和海水质量指数如表4所示。在河口贝类养殖海域中,pH、DO、COD和DIP的评价指数Pi均小于1,均符合海水水质二类标准,但滩涂区在10月的DIN评价指数为1.16,超出海水水质二类标准,说明滩涂区在10月时受到了DIN的污染。浅海区在12月、3月、6月、10月等4次调查月份中的海水质量等级均为1~2 级,总体处于较好水平;而滩涂区在10月的海水质量等级为3级,水质一般,其他调查月份为1~2级,处于较清洁或清洁状态。整体来看,河口贝类增养殖区海域海水质量良好,个别月份出现DIN污染现象,但均符合海水水质标准一类区或二类区贝类养殖环境的要求。
表4 东营河口贝类增养殖区海水质量综合评价
Tab.4
| 区域 Areas | 年-月 Year- month | 污染指数(Pi) Pollution index | 内梅罗综合 指数 P | 等级 Grade | 污染状况 Pollution status | ||||
|---|---|---|---|---|---|---|---|---|---|
| pH | DO | COD | DIN | DIP | |||||
| 滩涂区 Intertidal zone | 2020-12 | 0.80 | 0.11 | 0.11 | 0.11 | 0.05 | 0.59 | 2 | 较清洁 |
| 2021-03 | 0.76 | 0.20 | 0.09 | 0.15 | 0.02 | 0.56 | 2 | 较清洁 | |
| 2021-06 | 0.50 | 0.50 | 0.10 | 0.06 | 0.09 | 0.46 | 1 | 清洁 | |
| 2021-10 | 0.85 | 0.87 | 0.66 | 1.16 | 0.02 | 0.96 | 3 | 一般 | |
| 浅海区 Shallow sea area | 2020-12 | 0.84 | 0.13 | 0.11 | 0.06 | 0.02 | 0.62 | 2 | 较清洁 |
| 2021-03 | 0.88 | 0.16 | 0.22 | 0.20 | 0.02 | 0.65 | 2 | 较清洁 | |
| 2021-06 | 0.43 | 0.60 | 0.18 | 0.03 | 0.17 | 0.47 | 1 | 清洁 | |
| 2021-10 | 0.64 | 0.54 | 0.33 | 0.85 | 0.02 | 0.69 | 2 | 较清洁 | |
2.2.2 水体营养水平与有机污染评价
河口贝类增养殖区海域滩涂区和浅海区的营养状态指数(E)和有机污染评价指数(A)如表5所示。养殖海域各站位在4个调查航次的营养状态指数(E)均小于1,均未达到富营养化状态,其中滩涂区T1站位在10月的营养状态指数(E)接近于1,有富营养化趋势。因此,在10月时应注意对滩涂区养殖贝类的保护。从有机污染评价指数(A)来看,河口贝类增养殖区海域在12月与3月时水体环境水质评价良好;养殖海域的浅海区站位Q1、Q2以及滩涂区的T1、T2、T3在6月与10月时的有机污染指数(A)均介于0~1之间,水质环境为较好,其余则为良好。
表5 东营河口贝类增养殖区的营养状态指数(E)和有机污染评价指数(A)
Tab.5
| 指数 Index | 年-月 Year-month | 监测站位 Monitoring stations | |||||
|---|---|---|---|---|---|---|---|
| T1 | T2 | T3 | Q1 | Q2 | Q3 | ||
| 营养指数E | 2020-12 | 0.019 | 0.025 | 0.005 | 0.004 | 0.003 | 0.003 |
| 2021-03 | 0.012 | 0.001 | 0.013 | 0.091 | 0.003 | 0.016 | |
| 2021-06 | 0.019 | 0.007 | 0.002 | 0.021 | 0.043 | 0.005 | |
| 2021-10 | 0.931 | 0.260 | 0.27 | 0.156 | 0.076 | 0.266 | |
| 有机污染评价指数A | 2020-12 | -1.493 | -1.794 | -1.727 | -1.580 | -1.597 | -1.445 |
| 2021-03 | -0.883 | -1.298 | -0.979 | -0.200 | -1.833 | -1.478 | |
| 2021-06 | -0.043 | -0.458 | -0.640 | 0.074 | 0.143 | -0.208 | |
| 2021-10 | 0.637 | 0.566 | 0.285 | -0.391 | -0.267 | -0.015 | |
3 讨论
3.1 环境因子的季节变化分析
东营河口及近海潮间带滩涂是埋栖性贝类的主要栖息场所,本次调查的养殖区位于东营的马新河入海口处,养殖区主要出产文蛤和四角蛤蜊等经济贝类。其中,文蛤属广温和广盐性滩涂埋栖性双壳贝类,研究表明文蛤稚贝生长的温度和盐度范围分别为7.0~35.4℃、7.3~38.7[13],同时在低温-5.5℃下文蛤仍可正常存活。本次调查监测到养殖区6个站位水体水温和盐度的变化分别是1.40~27.90℃、25.00~35.50,均在文蛤生长适宜范围内。此外,杨杰青等[14]发现文蛤最适生长的pH为7.7~8.7。本研究结果表明河口养殖区的pH(7.93~8.48)较为稳定,且在养殖贝类适宜生长范围之内。海水pH变化与海水中无机碳平衡体系密切相关,而该平衡与温度、盐度、压力、无机碳平衡体系各组分含量变化密切相关。当温度升高时,由于电离常数增大,导致海水pH降低;同时,当降水及地表径流流入导致海水盐度下降时,离子强度变小,海水中碳酸的表观电离常数变小,导致海水的pH下降。因此,监测区夏季pH降低的原因,可能是受季节和水温的影响,其次是受降水量和黄河径流量等因素的影响[15]。DO是水产养殖过程中影响养殖生物存活和生长的关键环境因子,本次调查测得河口贝类增养殖区的DO变化趋势与前人报道的大辽河口的变化趋势一致[16]。本次调查养殖区的COD随季节变化趋势与2010年调查结果相似,但测定的COD值相比2010年明显降低。COD是传统水质监测中反映海水有机质的重要参数,研究发现COD与DIN有显著正相关关系,过高的COD易使海水出现富营养化,从而引发赤潮,最终对养殖对象产生危害[17]。根据海水水质二类标准,养殖水体的DO应在5.0 mg/L以上,COD小于3.00 mg/L。本研究海域DO浓度均在海水养殖安全范围之内,而COD浓度除10月滩涂区的监测点外,其他站位的COD浓度均符合水质标准。因此,应注意养殖区秋季海水的有机污染状况以及COD浓度变化,特别是近海滩涂区。同时,研究发现COD与赤潮浮游植物浓度呈极显著正相关关系[18],因此在COD浓度升高时,养殖区需加强对海水中浮游植物的跟踪监测。
3.2 营养盐的季节变化分析
营养盐是浮游植物生长繁殖的营养因子,而浮游植物又是多种贝类的饵料来源。因此,海洋中营养盐的浓度与分布会间接影响贝类的生长与繁殖,适量的营养盐可以促进浮游植物的生长,同时也为贝类提供充足的饵料,而过量的营养盐可能导致赤潮发生[19]。本次调查养殖区NH3-N的浓度变化特征与2010年相比略有不同,这可能与当地降雨量、海域环流速度、浮游动物的排泄、有机物分解,以及氮元素的氨化及硝化作用的程度等因素有关[20-21]。由于NO2-N是氮元素氧化还原的中间价态,NO2-N浓度变化可能与海水温度有关,适宜水温使细菌生命活动较为活跃,也会导致氮元素硝化作用和反硝化作用增强。同时,海水中NH3-N和NO2-N浓度过高会对各种海洋生物产生毒害作用[22]。研究证明,NH3-N≤0.15 mg/L[23]、NO2-N≤0.1 mg/L不会对贝类造成毒害作用[24]。相关研究表明,过量的氮输入会导致水体酸化、生态系统富营养化以及产生毒性等副作用,危害水生生物的生长繁殖,对养殖产生不利的影响[25-26]。2010年姜欢欢[27]对渤海近岸的7个贝类增殖区进行了水质监测与评价分析,发现该养殖区域水体富营养化,其中DIN和PO4-P浓度超标;刘澜鼎等[28]于2017—2019年对烟台养马岛贝类养殖区水质进行了监测分析,结果显示养殖区水体营养盐含量符合国家养殖区水质标准,但海域水质处于氮限制的贫营养化水平;何荣等[29]于2014年对渤海西部海域的天津汉沽贝类增养殖区的环境进行了监测与综合评价,研究显示养殖区营养盐超标,水体严重富营养化;姜磊[30]于2015—2018年对黄河三角洲近岸海域海水生态环境进行了连续4年的跟踪调查,并分析了变化趋势,研究结果表明DIN、COD和PO4-P是黄河三角洲近岸海域水质主要污染物,DIN和PO4-P浓度整体均呈上升趋势。研究表明,当DIN和DIP分别低于0.080、0.018 mg/L时,会影响浮游植物的生长[31],若养殖区海水中DIP浓度相对偏低,其可能成为该区域浮游植物生长繁殖的限制因子,使得浮游植物对磷浓度变化比较敏感。因此,一旦大量排污和大量径流输入等,将导致磷浓度增加,可能会促使养殖区浮游植物大量繁殖生长,甚至引发赤潮[32]。总体来说,河口贝类增养殖区氮磷平均浓度基本上虽处于安全浓度范围内,但养殖区秋季的NH3-N和NO2-N以及DIN浓度均超出海水水质二类标准,同时该养殖区海域DIP一直处于低浓度状态,可能会限制浮游植物的正常生长,对贝类养殖区产生影响,因此应特别注意对秋季养殖区氮、磷浓度陆源输入量的跟踪监测,防止其对贝类产生毒害作用,影响养殖容量和经济效益。
4 结论
1)东营河口贝类养殖区的DO、COD、DIN和DIP均符合养殖生物的海水水质标准。
2)内梅罗环境质量综合评价指数表明,河口贝类增养殖区污染评价等级均为较清洁或清洁状态,海水质量良好,总体符合海水水质标准一类区或二类区贝类养殖环境的要求。
3)富营养化指数评价和有机污染指数评价分析表明,东营河口贝类增养殖区水域水质整体处于良好状态,且在海水养殖环境标准范围内,但应注意秋季养殖区DIN的输入。
参考文献
Temporal and spatial variations and impact factors of nutrients in Bohai Bay, China
[J].
The temporal and spatial distributions of dissolved inorganic nitrogen (DIN), dissolved inorganic phosphorus (DIP), and dissolved silicate (DSi), and their long-term changes were investigated in Bohai Bay (BHB) in spring, summer, and autumn (2013-2014). The high DIN values were consistently distributed in the western inshore waters, mainly determined by terrestrial factors, e.g., riverine input, while DIP and DSi were mostly distributed in the southern coastal waters, the central BHB, or near the sea port Caofeidian in northern BHB, largely related to non-terrestrial factors, e.g., sediment release. Based on the nutrient distribution, BHB could be partitioned into western and eastern parts, with -15 m depth as the separation. The long-term variations of nutrients since 2000 showed an increase in DIN and decreases in DIP and DSi. Relatively slow changes in DIN and DIP and a rapid decrease in DSi were exhibited in summer, which was associated with precipitation and sediment release.Copyright © 2019 Elsevier Ltd. All rights reserved.
Long-term nutrient variations in the Bohai Sea over the past 40 years
[J].As China's only continental sea, the Bohai Sea is a relatively closed environment and is vulnerable to natural changes and human activities. In this paper, the long‐term variations in nutrients in the Bohai Sea and the potential influencing factors were analyzed based on historical summer and winter data from 1978 to 2016. The results showed that the concentrations of dissolved inorganic nitrogen (DIN) in the Bohai Sea continuously increased from 1990 and rapidly increased after 2002, the phosphate (PO4‐P) concentration exhibited a decreasing trend, and the silicate (SiO3‐Si) concentration decreased from 1978 to 1987 and increased from 1987 to 2008. The nutrient concentrations were lower in summer than in winter, and the bottom concentrations were higher than the surface concentrations in summer, whereas the vertical differences were insignificant in winter. The dominant factor determining the long‐term variations in DIN were atmospheric deposition and nonpoint sources due to various human activities; the primary factors affecting PO4‐P were riverine inputs and nonpoint sources related to natural changes and human activities; the primary factors afftecting SiO3‐Si were riverine inputs. The N/P ratio followed the DIN variation, the Si/P ratio followed the SiO3‐Si variation, and the Si/N ratio decreased. The nutrient ratios were lower at the bottom than at the surface and were lower in winter than in summer. The nutrient limitation changed from nitrogen limitation to phosphorus and silicon limitations. The long‐term nutrient variations in the Bohai Sea have potential ecological impacts on the local red tide features.
东海近海海域营养盐分布特征及其与赤潮发生关系的初步研究
[J].根据2002年4月25日~5月2日的调查数据,分析了东海近海海域营养盐(NO3--N,PO4^3-P,SiO3^2-Si,NH4-N等)的分布特征,并初步探讨了营养盐分布与赤潮发生的关系.结果表明,调查海区营养盐浓度较高,与国家一类海水水质相比,无机氮和无机磷的超标率分别为46%和60%,长江口及杭州湾附近海域富营养化程度比较严重.调查海域由于受沿岸长江等河流输入的影响。营养盐浓度自近岸向外海快速递减,等值线几乎与海岸线平行.根据调查结束后赤潮发生的特点和区域,表明营养盐浓度的增加,尤其是DIN和PO4^3-P的增加,与赤潮的发生有一定关系。但本次赤潮并不是发生在营养盐浓度最高的海区,因此,富营养化并不是诱发本次赤潮发生的唯一环境因素.
Toxicity of ammonia nitriteion, and orthophosphate to Mercenaria mercenaria and Crassostrea virginica
[J].
Ecological and toxicological effects of inorganic nitrogen pollution in aquatic ecosystems: a global assessment
[J].We provide a global assessment, with detailed multi-scale data, of the ecological and toxicological effects generated by inorganic nitrogen pollution in aquatic ecosystems. Our synthesis of the published scientific literature shows three major environmental problems: (1) it can increase the concentration of hydrogen ions in freshwater ecosystems without much acid-neutralizing capacity, resulting in acidification of those systems; (2) it can stimulate or enhance the development, maintenance and proliferation of primary producers, resulting in eutrophication of aquatic ecosystems; (3) it can reach toxic levels that impair the ability of aquatic animals to survive, grow and reproduce. Inorganic nitrogen pollution of ground and surface waters can also induce adverse effects on human health and economy. Because reductions in SO2 emissions have reduced the atmospheric deposition of H2SO4 across large portions of North America and Europe, while emissions of NOx have gone unchecked, HNO3 is now playing an increasing role in the acidification of freshwater ecosystems. This acidification process has caused several adverse effects on primary and secondary producers, with significant biotic impoverishments, particularly concerning invertebrates and fishes, in many atmospherically acidified lakes and streams. The cultural eutrophication of freshwater, estuarine, and coastal marine ecosystems can cause ecological and toxicological effects that are either directly or indirectly related to the proliferation of primary producers. Extensive kills of both invertebrates and fishes are probably the most dramatic manifestation of hypoxia (or anoxia) in eutrophic and hypereutrophic aquatic ecosystems with low water turnover rates. The decline in dissolved oxygen concentrations can also promote the formation of reduced compounds, such as hydrogen sulphide, resulting in higher adverse (toxic) effects on aquatic animals. Additionally, the occurrence of toxic algae can significantly contribute to the extensive kills of aquatic animals. Cyanobacteria, dinoflagellates and diatoms appear to be major responsible that may be stimulated by inorganic nitrogen pollution. Among the different inorganic nitrogenous compounds (NH4+, NH3, NO2-, HNO2NO3-) that aquatic animals can take up directly from the ambient water, unionized ammonia is the most toxic, while ammonium and nitrate ions are the least toxic. In general, seawater animals seem to be more tolerant to the toxicity of inorganic nitrogenous compounds than freshwater animals, probably because of the ameliorating effect of water salinity (sodium, chloride, calcium and other ions) on the tolerance of aquatic animals. Ingested nitrites and nitrates from polluted drinking waters can induce methemoglobinemia in humans, particularly in young infants, by blocking the oxygen-carrying capacity of hemoglobin. Ingested nitrites and nitrates also have a potential role in developing cancers of the digestive tract through their contribution to the formation of nitrosamines. In addition, some scientific evidences suggest that ingested nitrites and nitrates might result in mutagenicity, teratogenicity and birth defects, contribute to the risks of non-Hodgkin's lymphoma and bladder and ovarian cancers, play a role in the etiology of insulin-dependent diabetes mellitus and in the development of thyroid hypertrophy, or cause spontaneous abortions and respiratory tract infections. Indirect health hazards can occur as a consequence of algal toxins, causing nausea, vomiting, diarrhoea, pneumonia, gastroenteritis, hepatoenteritis, muscular cramps, and several poisoning syndromes (paralytic shellfish poisoning, neurotoxic shellfish poisoning, amnesic shellfish poisoning). Other indirect health hazards can also come from the potential relationship between inorganic nitrogen pollution and human infectious diseases (malaria, cholera). Human sickness and death, extensive kills of aquatic animals, and other negative effects, can have elevated costs on human economy, with the recreation and tourism industry suffering the most important economic impacts, at least locally. It is concluded that levels of total nitrogen lower than 0.5-1.0 mg TN/L could prevent aquatic ecosystems (excluding those ecosystems with naturally high N levels) from developing acidification and eutrophication, at least by inorganic nitrogen pollution. Those relatively low TN levels could also protect aquatic animals against the toxicity of inorganic nitrogenous compounds since, in the absence of eutrophication, surface waters usually present relatively high concentrations of dissolved oxygen, most inorganic reactive nitrogen being in the form of nitrate. Additionally, human health and economy would be safer from the adverse effects of inorganic nitrogen pollution.
海洋主要污染物对贝类及其环境的影响
[J].为给海水贝类健康养殖提供依据,本文总结了近年国内外的报道,从氮、磷、重金属、石油类、有机氯农药等海洋污染物对贝类及其环境影响及进行了归纳综述,发现由于特殊的取食方式,贝类体内的污染物含量较其它生物要高,此外,同种污染物在不同种类贝类体内的积累也存在显著差异。因此,贝类养殖区的选择要比其他养殖区的选择更加谨慎,另外,也可以针对不同养殖海域的具体情况因地制宜的选择不同的养殖种类。
烟台四十里湾海域养马岛贝类养殖区水质监测与评价
[J].于2017—2019年的5月至11月对烟台养马岛贝类养殖区进行水质监测,分析了该贝类养殖区近三年来的营养盐含量变化,并对该海域的有机污染状况进行评价,探讨其营养盐的潜在富营养化水平。结果表明,调查期间养马岛贝类养殖海域的溶解氧、化学需氧量、无机氮和活性磷酸盐均符合国家一类海水水质标准;该海域为氮限制的贫营养化水平;有机污染指数评价分析显示该海域水质状况以良好和较好为主;硝酸盐与铵盐呈显著的正相关;水温分别与溶解氧、亚硝酸盐呈显著负相关。总体而言,养马岛贝类养殖区符合国家养殖区水质标准,营养盐含量基本正常,适合贝类养殖。
