Study on carbon-phosphorus ratio of eleven reservoirs in Fujian Province
-
摘要:背景
水中碳(C)、氮(N)、磷(P)是影响藻类生长的主要限制元素,也影响浮游植物的群落结构。溶解性无机碳/总磷比(DIC/TP)的研究为缓解湖泊和水库的富营养化问题提供一个新的修复解决思路。
目的了解2023年夏、秋季福建省不同地区的11座水库(棉花滩水库、池潭水库、山美水库、东圳水库、东张水库、山仔水库、东溪水库、石兜水库、官昌水库、塘坂水库和坂头水库)的营养状态、浮游植物群落和碳磷比特征。
方法在2023年夏、秋季,以福建省不同地区的11座水库为研究对象,分别进行水质、浮游植物及环境因子现场采样监测。
结果11座水库的综合营养状态指数(TLI)在35.9~54.4之间,其中除官昌水库处于轻度富营养化水平外,其余10座水库均处于中营养水平。11座水库共检出浮游植物5门36属,其中绿藻门最多,有15属;蓝藻门为11属;硅藻门为7属;甲藻门为2属;隐藻门为1属。11座水库浮游植物密度范围为1.13×10⁶ ~5.77×10⁸ 个·L−1;蓝藻门在8座水库(棉花滩水库、池潭水库、东圳水库、东张水库、山仔水库、东溪水库、官昌水库、塘坂水库)中为优势门类。11座水库水体DIC/TP值为17.4~402.6,最低的是宁德市官昌水库,最高的是三明市池潭水库。通过相关性分析发现,DIC/TP与综合营养状态指数、浮游植物密度之间存在显著负相关关系。
结论碳磷比对浮游植物群落结构及富营养化有着显著的影响,对探究通过简单、低成本的方式来缓解富营养化具有重要的价值。
意义DIC/TP指标的创新,表明生物利用二氧化碳(CO2)和P的限制差异可通过调节水体中DIC浓度、TP浓度和DIC/TP值,改变浮游−沉水植物群落结构和组成,从而减缓水体富营养化进程。因此,基于水生生态系统碳磷限制效应,CO2对富营养化的缓解作用和DIC/TP指标的应用,是保护水质安全与促成水体碳增汇的双赢,也是在未来服务与管理生态系统的研究重点。
Abstract:BackgroundCarbon (C), nitrogen (N), and phosphorus (P) in water are the main limiting elements that affect the growth of algae and the community structure of phytoplankton. The study of the dissolved inorganic carbon/total phosphorus ratio (DIC/TP) provides an important way to alleviate the eutrophication problem of reservoirs and lakes, which provides a new restoration solution of it.
ObjectiveThe study aims to analyze the nutritional status, phytoplankton community characteristics and carbon-phosphorus ratio of 11 reservoirs (Mianhuatan Reservoir, Chitan Reservoir, Shanmei Reservoir, Dongzhen Reservoir, Dongzhang Reservoir, Shanzai Reservoir, Dongxi Reservoir, Shidou Reservoir, Guanchang Reservoir, Tangban Reservoir, and Bantou Reservoir) in different areas of Fujian Province in the summer and autumn of 2023.
MethodsIn the summer and autumn of 2023, 11 reservoirs in different areas of Fujian Province were used as research objects to conduct on-site sampling and monitoring of water quality, phytoplankton and environmental factors.
ResultsIt was shown that the comprehensive trophic level index (TLI) of 11 reservoirs ranged from 35.9 to 54.4, while Guanchang Reservior was at the mild eutrophication level, and the other 10 reservoirs were at the mesotrophic level. A total of 5 phytoplankton were detected in the 11 reservoirs. There were 36 genera in the phylum, of which Chlorophyta had the most with 15 genus, Cyanophyta had 11 genus, Bacillariophyta had 7 genus, Pyrrophyta had 2 genus, and Cryptophyta had 1 genus. The density of phytoplankton ranged from 1.13×10⁶ to 5.77×10⁸ cells·L−1, and Cyanophyta was the dominant category in 8 reservoirs (Mianhuatan Reservoir, Chitan Reservoir, Dongzhen Reservoir, Dongzhang Reservoir, Shanzai Reservoir, Dongxi Reservoir, Guanchang Reservoir, and Tangban Reservoir). The DIC/TP value of water bodies in 11 reservoirs ranged from 17.4 to 402.6, with the lowest DIC/TP value was observed in Guanchang Reservoir in Ningde City, and the highest DIC/TP was observed in Chitan Reservoir in Sanming City. Through correlation analysis, it was found that there was a significant negative correlation between DIC/TP, nutritional status index and phytoplankton density.
ConclusionThe carbon-phosphorus ratio has a significant impact on the phytoplankton community structure and eutrophication, and is of great value in exploring simple and low-cost ways to alleviate eutrophication.
SignificanceThe innovation of DIC/TP index shows that the difference in limitations of biological utilization of CO2 and P can change the structure and composition of planktonic-submersed plant communities by adjusting the concentration of DIC, TP and DIC/TP in the water body, thereby mitigating eutrophication process in the water bodies. Therefore, based on the carbon and phosphorus limiting effect of aquatic ecosystems, considering the mitigation effect of CO2 on eutrophication and the application of DIC/TP indicators is a win-win situation for protecting water quality safety and promoting water body carbon sinks, as well as research on serving and managing ecosystems in the future.
-
Keywords:
- carbon-phosphorus ratio /
- nutritional status /
- algae bloom /
- eutrophication /
- reservoir
-
传统观点认为,水温、光照、氮(N)和磷(P)是影响湖泊中浮游植物生物量的关键因素,N和P的可用性会限制浮游植物基本结构的形成,从而影响其光合作用和生长速率以及可达到的最大生物量[1]。特定的藻类物种或物种群因具有碳浓度机制(Carbon concentration mechanism,CCM)等生理适应性的特点,而能够以光合作用和吸收等方式利用营养物质,当这些物质改变时,水体中藻类物种也会随之改变。经过多年的实践和研究发现,当湖泊出现富营养化时,仅仅通过控制N、P输入的浓度来控制富营养化的方法太过单一[2],需要探索出更多解决富营养化问题的方法。
20世纪70年代的营养理论获得了淡水生态学家的普遍认同,认为溶解性无机碳(Dissolved inorganic carbon,DIC)浓度不会限制湖泊中浮游植物的生物量,是因为在营养富集引起的浮游植物密集生长过程中,水体中二氧化碳(Carbon dioxide,CO2)的消耗会刺激其对大气中CO2的吸收,以满足水体中浮游植物的光合作用和浮游动物鱼类等的生长需求[3-4]。但有研究表明,在纯物种连续培养中,当营养比例偏离Redfield比例(海洋中浮游生物的C∶N∶P)时,可以观察到不同浓度的C、N、P营养元素对浮游植物密度的影响,从而确定某种营养元素成为浮游植物的限制性元素,如当水体中C∶N∶P值发生变化时,水生植物的元素比例、酶活性和化学物质的组成也随之改变,从而限制水生植物的生长,影响浮游植物群落的组成[5]。通过近年来的实验[6-7]表明,在低等~中等DIC浓度的富营养化湖泊中,更多的DIC供应会刺激短期浮游植物生物量的发展及其生产力的提升,浮游植物群落表现出广泛的吸收无机碳的能力[8],如蓝藻可在低CO2浓度条件下生长[9-10];而硅藻和绿藻对C的需求较大,只有高CO2浓度环境才有利于其生存[11-13]。由此可知,提高水体中硅藻和绿藻的竞争力,改变浮游生物群落结构,减少有害蓝藻的相对丰度,可在一定程度上抑制有害的蓝藻水华,缓解湖泊富营养化[14]。研究也发现,当DIC与总磷(Total phosphorus,TP)比值(DIC/TP)较高时,水体光合作用增强,也能抑制蓝藻暴发[15-16]。综上研究分析认为,利用生物对CO2吸收的差异性,且在控制N、P的情况下,CO2浓度增加对改变地表水生态系统浮游植物群落的生长和组成有显著的影响,即通过向CO2分压较低的水生生态系统中增加CO2浓度,可以缓解蓝藻水华带来的危害,同时也能加强水体中的碳固存。因此,可以分析出C在富营养化水体中的限制性作用,并且因受DIC浓度增加的效应,其会影响形成高pH、高溶解氧(Dissolved oxygen,DO)的水体环境,从而促使水体中P易被铁氧化物吸附,导致水体中可溶性磷向难溶性磷转化[1],这也表明调节水体中营养元素比值(DIC/TP),可形成对生物碳泵效应的负反馈机制,进一步缓解水体向富营养化方向发展。
福建省(N23°33′~N28°20′、E115°50′~E120°40′)水系密布,河流众多,流域面积在50 km2以上的河流共有740条。据不完全统计,福建省共有
5000 多座大中小型水库[17]。为研究福建省水库碳磷营养盐对水体富营养化的影响,在2023年夏、秋季对福建省不同地区的11座水库进行水质、浮游植物样品的采集,分析不同水库的营养状态、浮游植物群落结构与碳磷比,以及碳磷比与营养状态间的关系,以期为福建省水库富营养化修复提供重要参考,进一步改善水体水质,并降低富营养化水体中有害蓝藻及其代谢物的产生对鱼类生存和相关渔业资源发展带来的巨大影响,有助于渔业生态环境保护事业的发展。1. 研究区域和方法
1.1 研究区域
于2023年夏、秋季,选择福建省主要地市的11座水库(表1)进行野外采样。11座水库的选择根据库容、类别、地区、使用功能以及富营养化严重程度等方面确定。按照SL 252—2017《水利水电工程等级划分及洪水标准》[18]的规定,根据水库总库容(V),将水库划分为5个类别:大(1)型(V≥1×10⁹ m3)、大(2)型(1×10⁸ m3≤V<1×10⁹ m3)、中型(1×10⁷ m3≤V<1×10⁸ m3)、小(1)型(1×10⁶ m3≤V<1×10⁷ m3)和小(2)型(1×10⁵ m3≤V<1×10⁶ m3)。
表 1 水库分布信息Table 1. Distribution information of the reservoirs水库
Reservoirs所属城市
Cities经纬度
Latitude and longitude所属流域
Drainage basins总库容/×108 m³
Total storage capacity功能
Functions类别
Category棉花滩水库
Mianhuatan Reservoir龙岩 N24°40'44.22"、
E116°33'52.47"汀江流域 16.95 发电、防洪 大(1)型 池潭水库
Chitan Reservoir三明 N26°49'56.21"、
E117°02'22.20"闽江流域 8.70 发电、防洪 大(2)型 山美水库
Shanmei Reservoir泉州 N25°09'41.32"、
E118°25'21.28"晋江流域 6.55 灌溉、防洪、发电 大(2)型 东圳水库
Dongzhen Reservoir莆田 N25°29'02.46"、
E118°56'49.17"木兰溪流域 4.35 灌溉、防洪、发电 大(2)型 东张水库
Dongzhang Reservoir福州 N25°42'27.45"、
E119°15'57.47"龙江流域 2.06 供水、发电、灌溉 大(2)型 山仔水库
Shanzai Reservoir福州 N26°22'17.27"、
E119°18'30.15"敖江流域 1.72 供水、防洪、发电 大(2)型 东溪水库
Dongxi Reservoir南平 N27°47'43.75"、
E118°06'34.03"闽江流域 1.02 灌溉、发电 大(2)型 石兜水库
Shidou Reservoir厦门 N24°42'02.93"、
E118°00'39.20"后溪流域 0.61 供水 中型 官昌水库
Guanchang Reservoir宁德 N26°45'41.15"、
E119°28'44.58"七都溪流域 0.24 供水、灌溉 中型 塘坂水库
Tangban Reservoir福州 N26°17'46.15"、
E119°22'23.83"敖江流域 0.08 供水 小(1)型 坂头水库
Bantou Reservoir厦门 N24°40'38.30"、
E118°01'30.63"后溪流域 0.04 供水 小(1)型 1.2 研究方法
1.2.1 样品采集
1)水质
每次用5 L有机玻璃采水器在水库库心位置水面下0.5 m 处获取水样,并将水样用500 mL聚乙烯塑料瓶收集,平行双样。聚乙烯塑料瓶在使用前,于实验室使用纯水进行清洗和自然晾干;在采集水样时,用对应点位的水库水润洗后,再使用。采集水样的同时,记录采样水体周围的环境、采样点的位置坐标和采样水体水温等信息。完成采集后,应及时将水样带回实验室,并进行相关水质指标的测定分析。
2)浮游植物
使用5 L有机玻璃采水器进行采集,取1 L水样置于聚乙烯塑料瓶中。在现场用15%鲁哥试剂进行固定。带回实验室静置、沉淀48 h后,利用虹吸法,将上清液吸除,再定容至30~50 mL,存放在50 mL聚乙烯塑料离心管中。使用江南BM-1000光学显微镜进行浮游植物鉴定、计数,具体为吸取0.1 mL水样于浮游植物计数框中,在40倍物镜下,观察100个视野[19]。每个固定水样需要进行2次计数,取平均值。若2次计数结果相差超过15%,则需要进行第3次计数,直至2次计数结果的差值在15%以内[20]。浮游植物种类鉴定参照《中国淡水藻类——系统、分类及生态》[21]。
1.2.2 水质理化指标
在样品采集过程中,使用塞氏盘(Security-Disk)对水体透明度(Secchi disk depth,SD)进行测量;采用美国HACH(哈希)pHC301酸度计、HACH(哈希)HQ30d溶氧仪、HACH(哈希)2100Q浊度仪等仪器在现场监测水温(Temperature,T)、pH、DO和浊度(Turbidity,Tur),测量精度分别为0.1℃、0.01、0.01 mg/L和0.01 NTU;同时,使用BBE野外藻类分析仪(Fluoroprobe)测定浮游植物藻密度及叶绿素a(Chlorophyl-a,Chl-a)浓度。
将样品带回实验室后,采用钼酸铵分光光度法测定总磷含量;采用碱性过硫酸钾消解紫外分光光度法测定总氮(Total nitrogen,TN)含量;采用GB/T 5750.7—2023《生活饮用水标准检验方法 第7部分:有机物综合指标》测定高锰酸盐指数(Permanganate index,CODMn)。
将水样通过醋酸纤维滤膜(0.45 μm)过滤,并收集至20 mL玻璃瓶中,然后用8 μL饱和氯化汞固定滤液,4 ℃保存。使用岛津TOC-L CPH总有机碳分析仪[22]对水中的溶解性碳(Dissolved carbon,DC)和DIC浓度进行测定,DC与DIC的差值即为溶解性有机碳(Dissolved organic carbon,DOC)浓度。计算DIC/TP、DOC/TP、DC/TP等碳磷比,探究不同形式的碳磷比与营养状态、浮游植物密度间的关系。
1.2.3 浮游植物总密度
浮游植物总密度表示单位体积水体中浮游植物的数量。浮游植物总密度鉴定方法参考SL 733—2016《内陆水域浮游植物监测技术规程》[23],根据每个视野中浮游植物的个数采用不同的方法进行计数,确定优势种。
1.2.4 综合营养状态指数
综合营养状态指数(Comprehensive trophic level index,TLI)法是根据中华人民共和国生态环境部颁布的HJ 91.2—2022《地表水环境质量评价技术规范》[24]对湖库营养状态进行评价的一种方法,该方法首先分别对各参评项目营养状态指数进行计算,其次对参评项目相关权重进行计算,最后得出TLI值。
TLI∑nj=1=Wj×TLI(j) (1)
式(1)中:TLI(j)为第 j 种参评项目的营养状态指数;Wj为第 j 种参评项目的营养状态指数的相关权重,其中Chl-a、TP、TN、SD和CODMn的权重分别为0.266 3、0.187 9、0.179 0、0.183 4和0.183 4。
各参评项目营养状态指数的计算公式为:
TLI(TP)=10×(9.436+1.624lnTP) (2)
TLI(TN)=10×(5.453+1.694lnTN) (3)
TLI(SD)=10×(5.118−1.94lnSD) (4)
TLI(CODMn)=10×(0.109+2.661lnCODMn) (5)
TLI(Chl-a)=10×(2.5+1.086lnChl-a) (6)
式(2)~式(6)中:Chl-a的单位为μg·L−1;SD的单位为m;其余指标的单位为mg·L−1。
1.3 数据处理与分析
使用Excel 2021对样品数据进行汇总处理。对各指标进行对数处理,缩小数值间的差异,并使用Origin 2022 Pro绘制数据图表和IBM SPSS Statistics 27统计分析。
2. 结果与分析
2.1 福建省11座水库营养状态
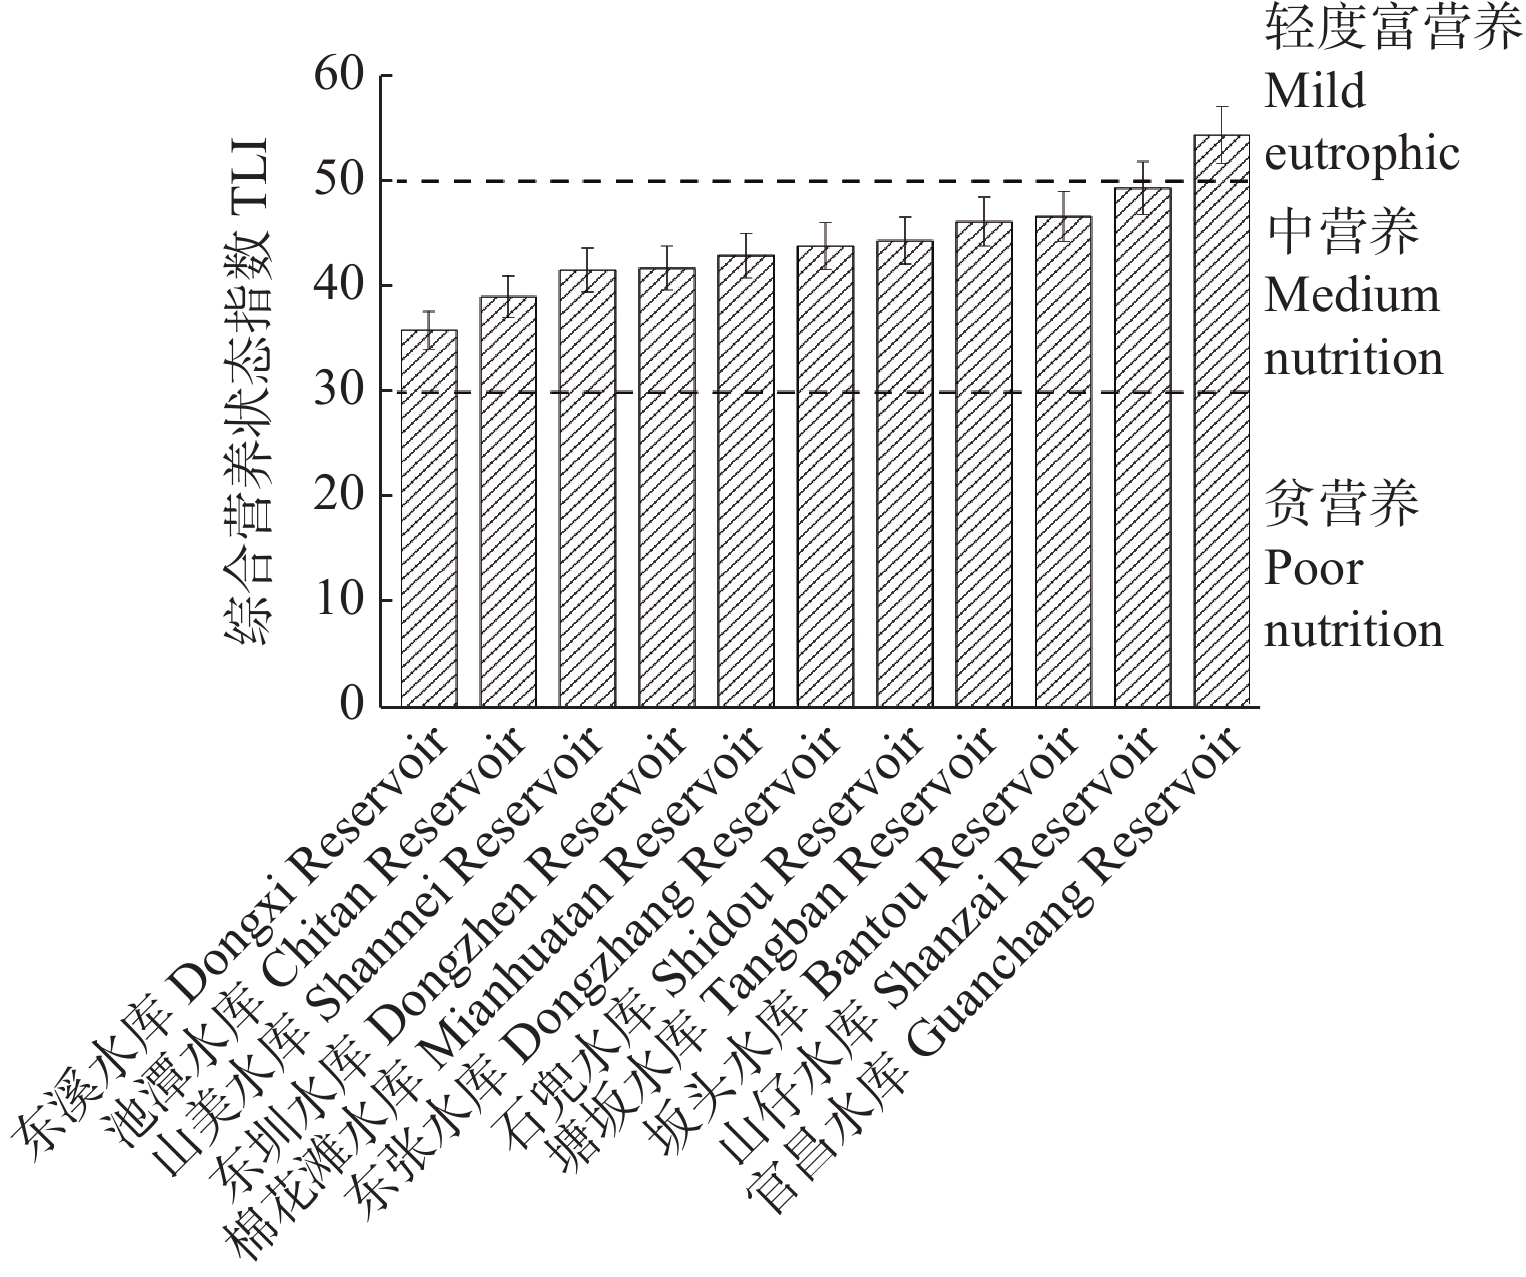
如图1所示,11座水库的TLI值在35.9~54.4之间,平均值为44.2,其中山区的南平市东溪水库、三明市池潭水库、龙岩市棉花滩水库,沿海的福州市东张水库、塘坂水库和山仔水库,莆田市东圳水库,泉州市山美水库,以及厦门市的石兜水库和坂头水库等10座水库均处于中营养水平;宁德市官昌水库的TLI值最高,为54.4,处于轻度富营养化水平;南平市东溪水库的TLI值最低(35.9),三明市池潭水库也较低(39.1)。结果表明,相较于多数山区型水库,沿海地区的水库营养水平更高,可能是因为山区水库受到的人类活动干扰相对较少,污染源相对于其他流域较少,水质相对较为清洁,而沿海地区经济较发达,人类活动密集,水资源供需矛盾突出,产生的污水容易汇入水体,进而导致沿海地区的水库面临更大的污染压力,营养物负荷也更高。
2.2 福建省11座水库的浮游植物特征
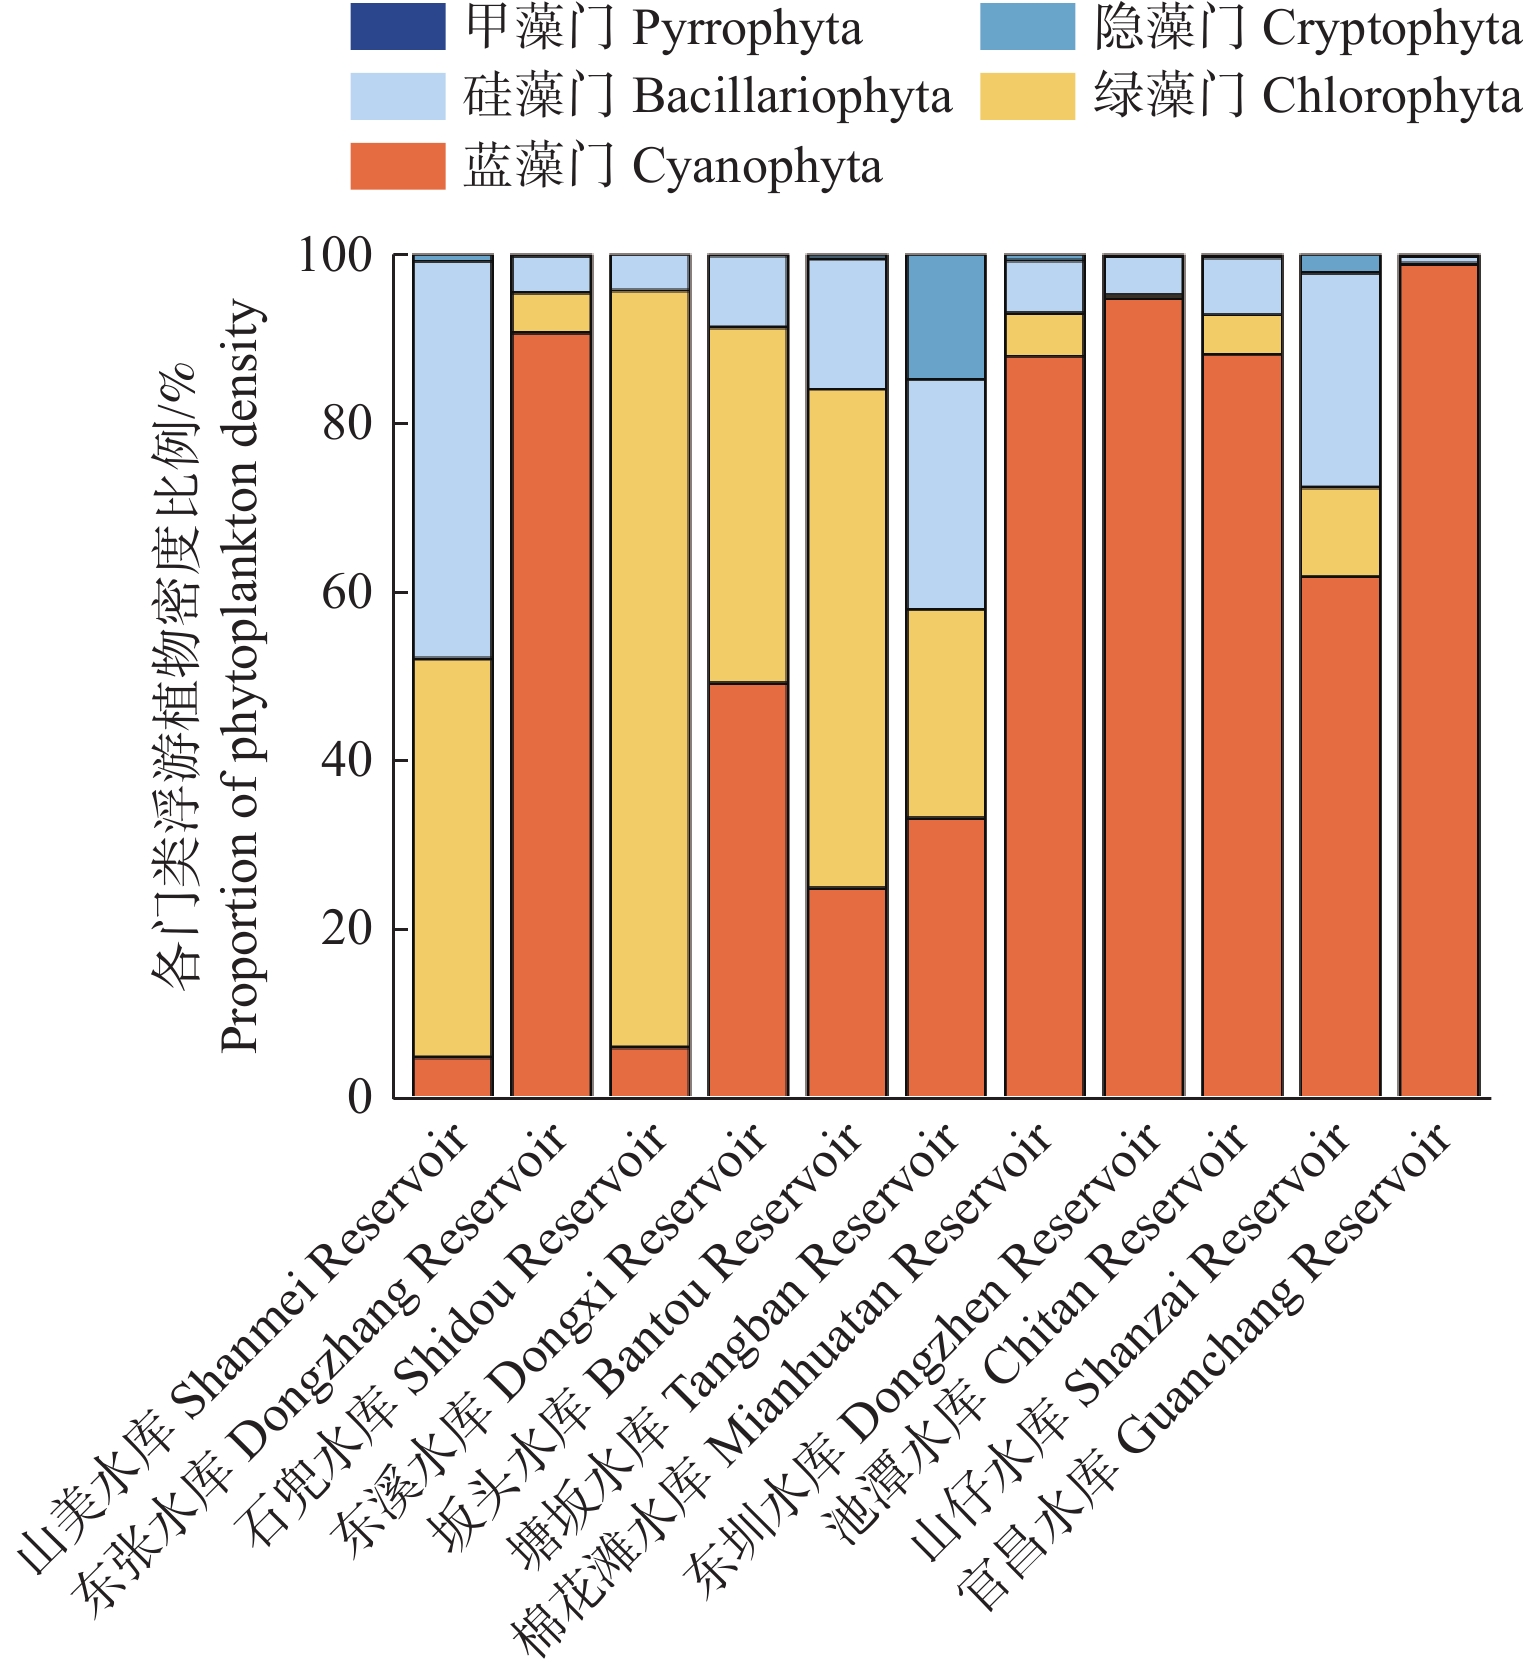
浮游植物的鉴定结果显示,11座水库共被检出5门36属藻类(表2),其中绿藻门最多,为15属;蓝藻门为11属;硅藻门为7属;甲藻门为2属;隐藻门为1属。常见的有绿藻门的小球藻属(Chlorella)、衣藻属(Chlamydomonas)、卵囊藻属(Oocystis)、栅藻属(Scenedesmus)、十字藻属(Crucigenia)、新月藻属(Closterium)、鼓藻属(Cosmarium)等;蓝藻门的微囊藻属(Microcystis)、颤藻属(Oscillatoria)、色球藻属(Chroococcus)、螺旋藻属(Spirulina)等;硅藻门的小环藻属(Cyclotella)、针杆藻属(Synedra)、直链藻属(Melosira)、舟形藻属(Navicula)等;甲藻门的角甲藻属(Ceratium)等;隐藻门的隐藻属(Cryptomonas)等。其中,蓝藻门微囊藻属在11座水库中均存在(图2)。
表 2 福建省11座水库浮游植物门类鉴定结果Table 2. Phytoplankton identification results of 11 reservoirs in Fujian Province门 Phyla 属 Genera 绿藻门 Chlorophyta 小球藻属、衣藻属、卵囊藻属、栅藻属、十字藻属、新月藻属、鼓藻属、弓形藻属(Schroederia)、空球藻属( Eudorina )、四角藻属(Tetraedron )、顶棘藻属(Chodatella )、蹄形藻属(Hippodonta)、空星藻属(Coelastrum)、角星鼓藻属(Staurastrum)、盘藻属(Gonium) 蓝藻门 Cyanophyta 微囊藻属、颤藻属、色球藻属、螺旋藻属、假鱼腥藻属(Pseudanabaena)、束丝藻属(Aphanizomenon)、平裂藻属(Merismopedia)、鱼腥藻属(Anabaena)、尖头藻属(Raphidiopsis)、项圈藻属(Anabaenopsis)、细鞘丝藻属(Leptolyngbya) 硅藻门 Bacillariophyta 小环藻属、针杆藻属、直链藻属、舟形藻属、曲壳藻属(Achnanthes)、等片藻属(Diatoma)、舟形藻属(Navicula) 甲藻门 Pyrrophyta 角甲藻属、多甲藻属(Peridinium) 隐藻门 Cryptophyta 隐藻属 2023年夏、秋季,11座水库的浮游植物密度范围为1.13×10⁶~5.77×10⁸ 个·L−1(表3)。表层浮游植物密度最高的是官昌水库,为5.77×10⁸ 个·L−1;浮游植物密度最低的是山美水库,为1.13×10⁶ 个·L−1。对11座水库浮游植物密度进行显著性差异分析,结果显示11座水库浮游植物密度之间差异不显著(P>0.05),与夏、秋季藻类生物量较多的水库的营养程度较高相符。不同营养状态的水库浮游植物密度存在差别,其中官昌水库的浮游植物密度远高于其他水库。
表 3 福建省11座水库浮游植物密度(×107个·L−1)Table 3. Phytoplankton density of 11 reservoirs in Fujian Province (×107cells·L−1)水库
Reservoirs山美水库
Shanmei Reservoir东张水库
Dongzhang Reservoir石兜水库
Shidou Reservoir东溪水库
Dongxi Reservoir坂头水库
Bantou Reservoir塘坂水库
Tangban Reservoir棉花滩水库
Mianhuatan Reservoir东圳水库
Dongzhen Reservoir池潭水库
Chitan Reservoir山仔水库
Shanmei Reservoir官昌水库
Guanchang Reservoir浮游植物密度
Phytoplankton density0.11 4.93 0.57 1.26 0.82 0.95 1.64 2.31 3.39 3.40 57.70 从图2知,蓝藻门在8座水库(东张水库、东溪水库、塘坂水库、棉花滩水库、东圳水库、池潭水库、山仔水库、官昌水库)中成为优势门类;2座水库(石兜水库、坂头水库)是以绿藻门为优势门类;1座水库(山美水库)以绿藻门和硅藻门为优势门类。不同水库的浮游植物丰度组成也不同,其中东圳水库的浮游植物组成为蓝藻−硅藻型;东张水库、东溪水库、池潭水库和棉花滩水库为蓝藻−绿藻−硅藻型;坂头水库、石兜水库和山美水库为绿藻−硅藻−蓝藻型;塘坂水库、山仔水库为蓝藻−硅藻−绿藻−隐藻型;官昌水库为蓝藻−甲藻型。
2.3 福建省11座水库碳磷比特征
福建省11座水库的TP浓度范围为(0.02±0.00)~(0.42±0.02)mg·L−1,其中宁德市官昌水库的TP浓度最高,为(0.42±0.02)mg·L−1;泉州市山美水库、南平市东溪水库、莆田市东圳水库以及三明市池潭水库的TP浓度均最低,均为(0.02±0.00)mg·L−1。
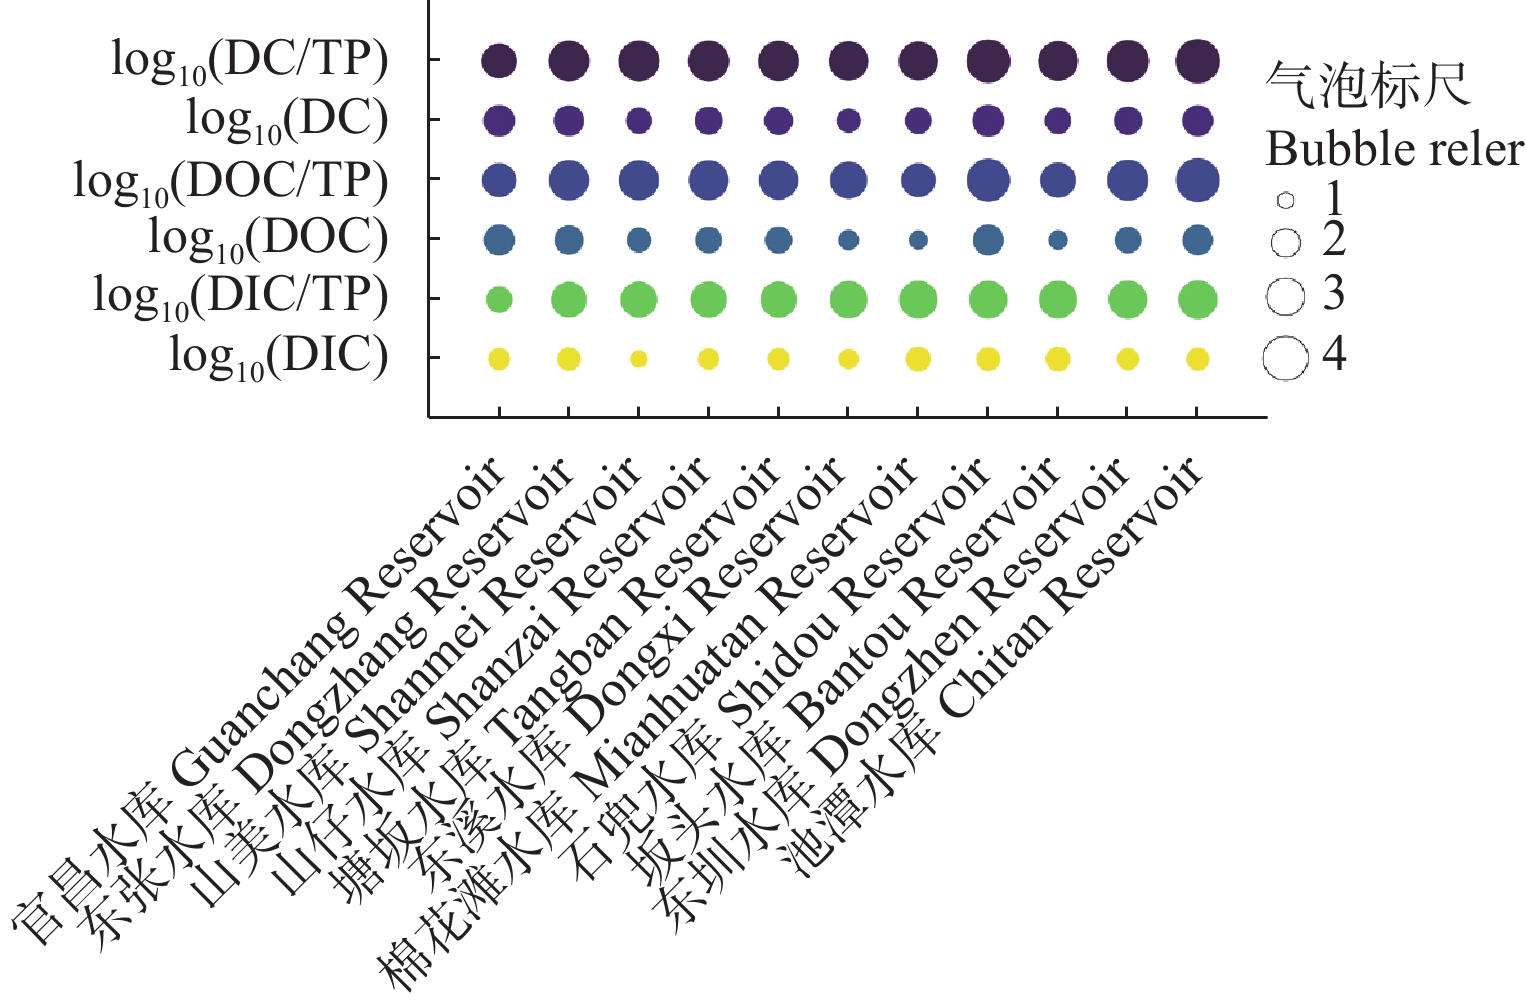
从图3中log10(DIC)气泡中看出:1)龙岩市棉花滩水库的log10(DIC)气泡最大,表明棉花滩水库的DIC浓度最高,为(13.02±0.65) mg·L−1;泉州市山美水库的log10(DIC)气泡最小,表明山美水库的DIC浓度最低,为(3.49±0.17) mg·L−1。2)石兜水库的log10(DOC)气泡最大,表明石兜水库的DOC浓度最高,为(46.57±2.33) mg·L−1,棉花滩水库的log10(DOC)气泡最小,表明棉花滩水库的DOC浓度最低,为(4.30±0.2) mg·L−1。结果显示,除龙岩市棉花滩水库与厦门市坂头水库的DOC浓度小于DIC浓度外,其余水库的DOC浓度均高于DIC浓度。
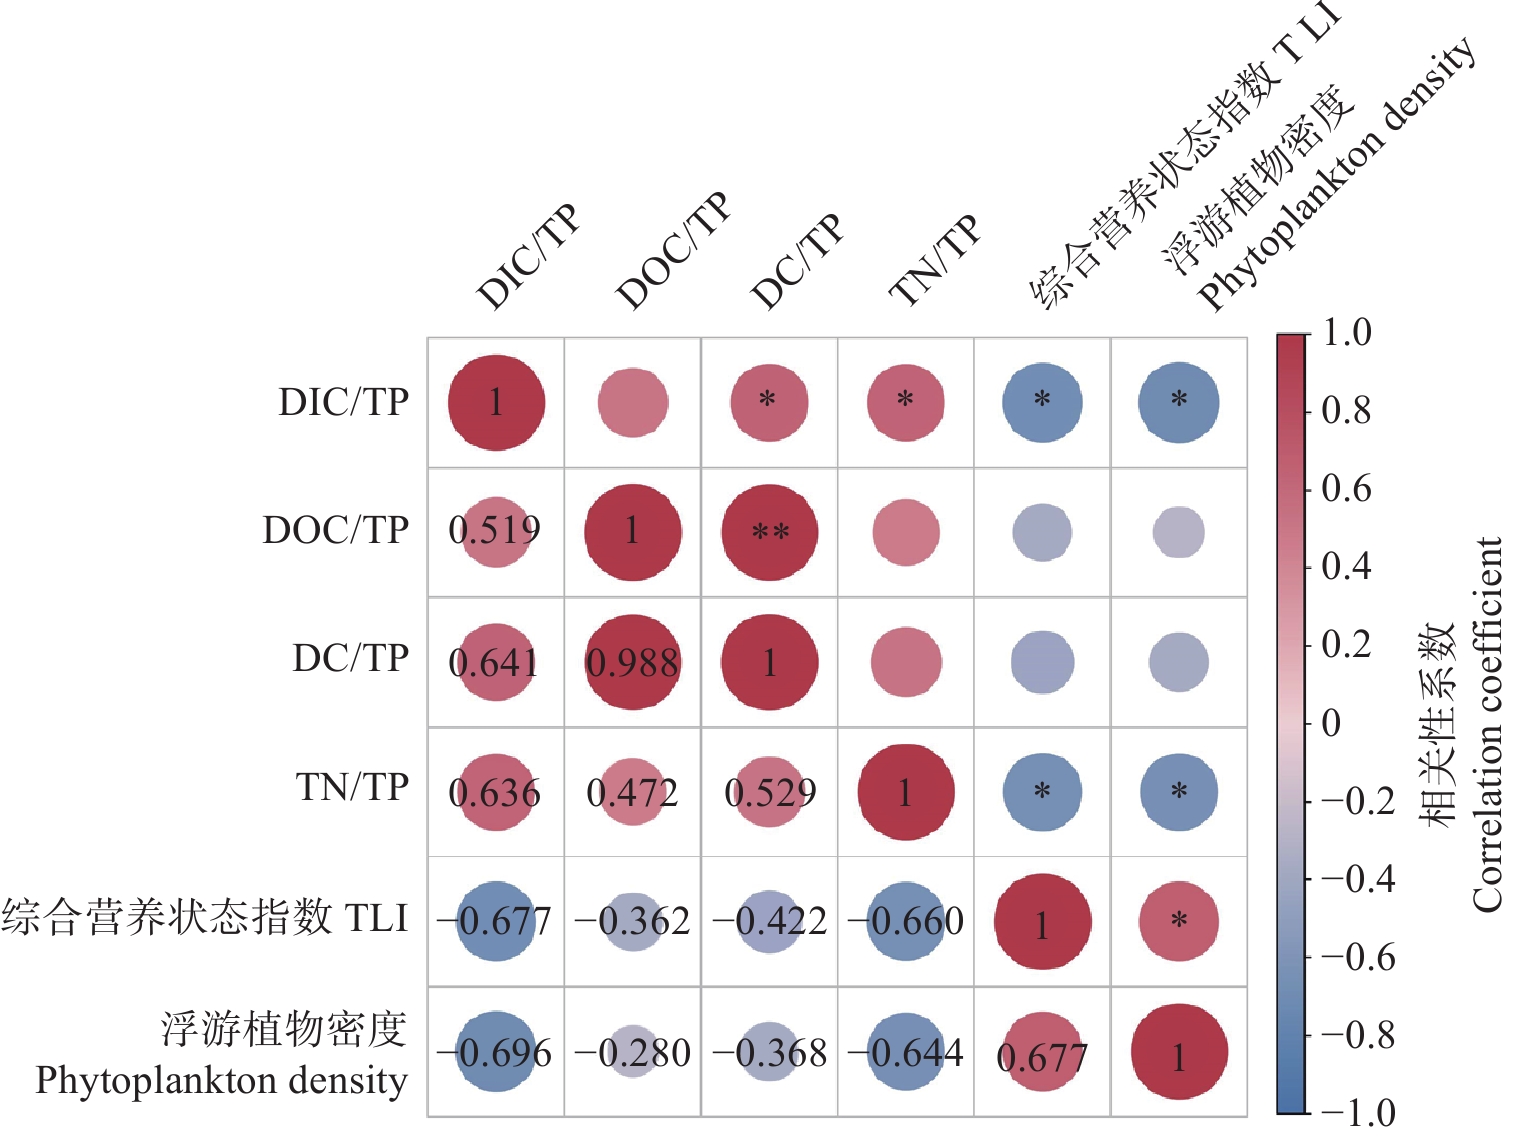
11座水库的DIC/TP、DOC/TP、DC/TP和TN/TP等指标与水体TLI、浮游植物密度的关系如图4所示。通过Pearson相关性分析,发现DIC/TP与TLI(r=−0.677,P<0.05,n=11)、浮游植物密度(r=−0.696,P<0.05,n=11)均有显著的负相关关系,与TN/TP、DC/TP呈显著正相关(r=0.636,P<0.05,n=11;r=0.641,P<0.05,n=11);TLI与浮游植物密度呈显著正相关关系(r=0.677,P<0.05,n=11);DOC/TP、DC/TP与TLI、浮游植物密度均未呈现显著相关性。结果表明,DIC/TP可成为表征水库营养状态的新指标。
![]() 图 4 福建省11座水库碳磷比与综合营养状态指数(TLI)、浮游植物密度的相关性分析注:*表示在 P<0.05(双尾)水平显著;**表示在 P<0.01(双尾)水平极显著。左下圆圈内数值表示相关性系数,圆圈颜色越深表示相关性越好。行、列均代表指标,横纵交叉表示行指标与列指标间的相关系数和显著水平。Figure 4. Correlation analysis of carbon-phosphorus ratio with TLI and phytoplankton density of 11 reservoirs in Fujian ProvinceNotes: * indicates significan differences at P<0.05 (two tails) level; ** indicates extremely significant differences at P<0.01 (two tails) level. The values in the lower left circle represent the correlation coefficient. The darker the circle, the better the correlation. Rows and columns both represent indicators, and the crosses of horizontal and vertical represent the correlation coefficient and significance level between row indicators and column indicators.
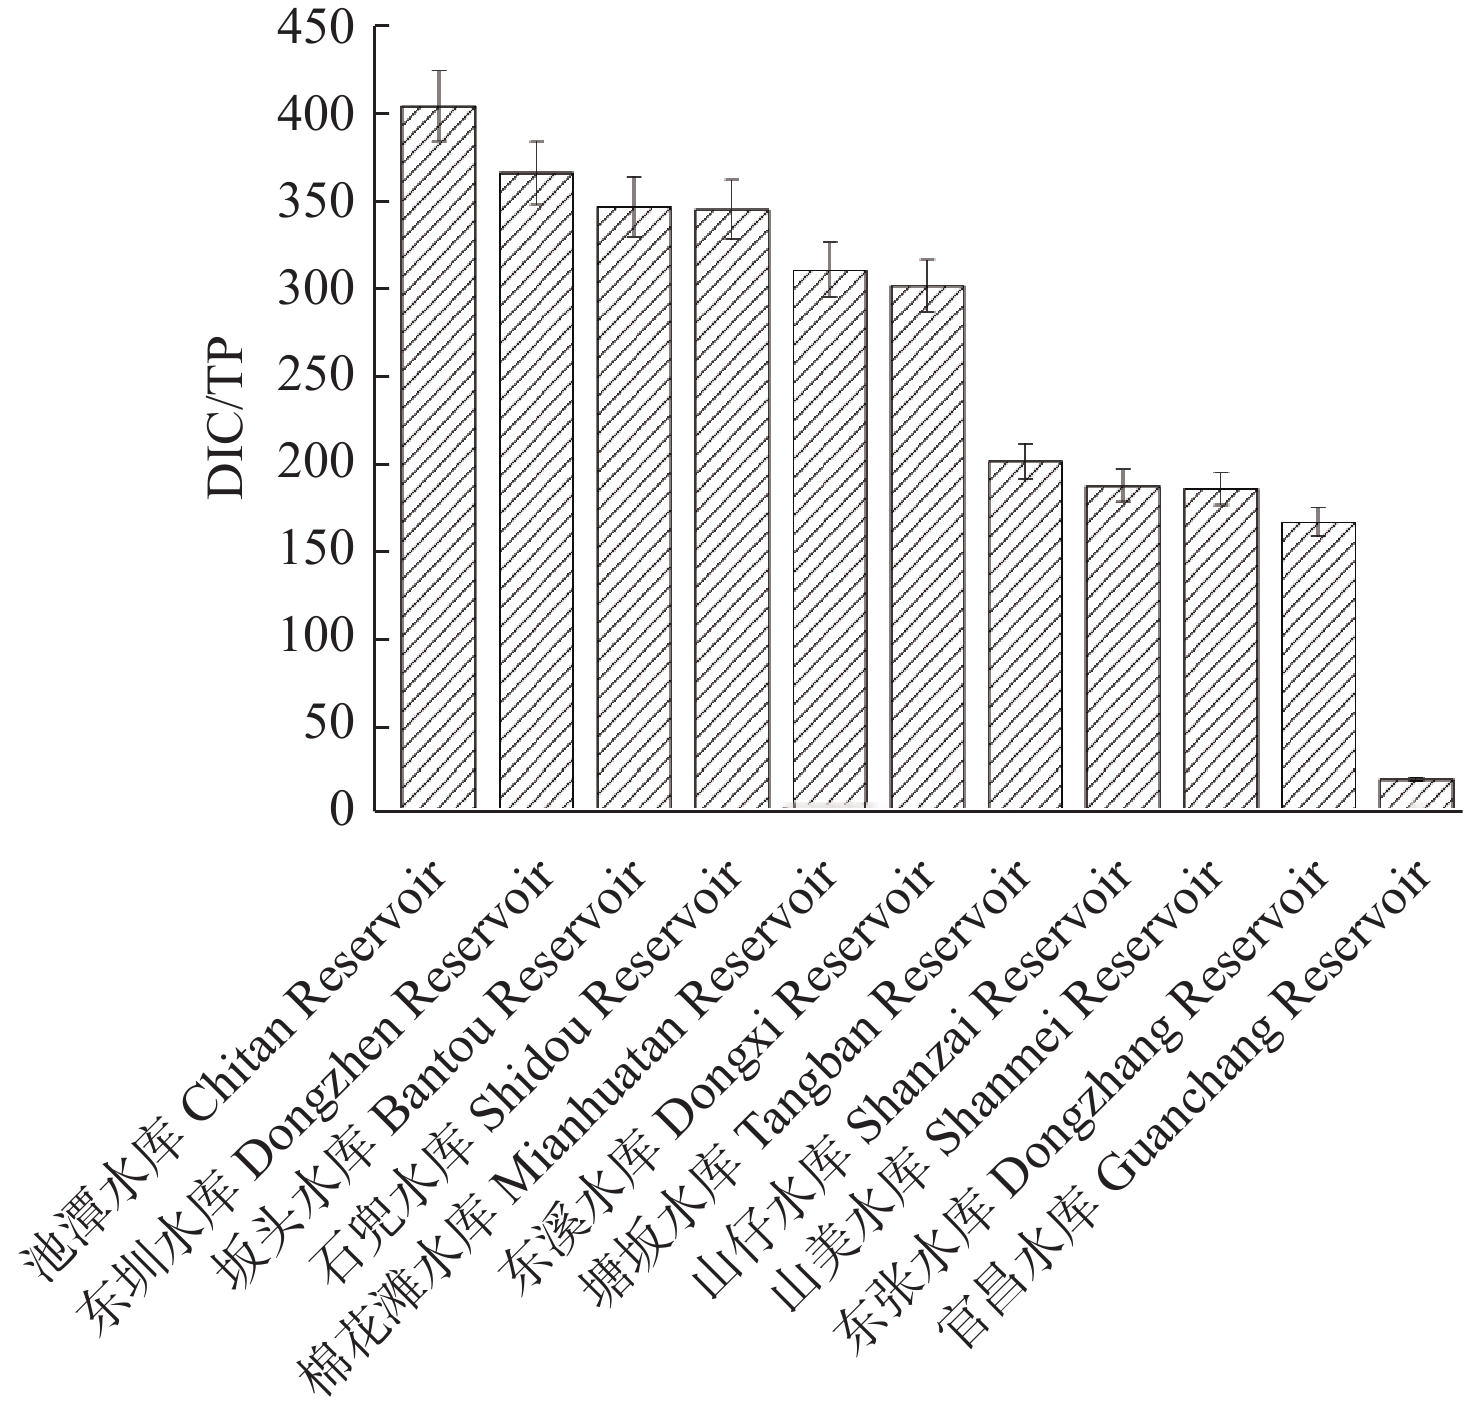
图 4 福建省11座水库碳磷比与综合营养状态指数(TLI)、浮游植物密度的相关性分析注:*表示在 P<0.05(双尾)水平显著;**表示在 P<0.01(双尾)水平极显著。左下圆圈内数值表示相关性系数,圆圈颜色越深表示相关性越好。行、列均代表指标,横纵交叉表示行指标与列指标间的相关系数和显著水平。Figure 4. Correlation analysis of carbon-phosphorus ratio with TLI and phytoplankton density of 11 reservoirs in Fujian ProvinceNotes: * indicates significan differences at P<0.05 (two tails) level; ** indicates extremely significant differences at P<0.01 (two tails) level. The values in the lower left circle represent the correlation coefficient. The darker the circle, the better the correlation. Rows and columns both represent indicators, and the crosses of horizontal and vertical represent the correlation coefficient and significance level between row indicators and column indicators.通过分析11座水库的DIC/TP值(图5),可知DIC/TP值的变化范围较大,在17.4~402.6之间。其中,宁德市官昌水库的DIC/TP值最低,为17.4;三明市池潭水库的DIC/TP值最高,达到402.6。结果表明,与中营养水库相比,轻度富营养化水库的DIC/TP值更低。
3. 讨论
3.1 DIC/TP作为水体营养状态指标的可行性
目前,TLI法是最常用的富营养化水平评价方法,但其已不适用于评估多年变化的湖泊或水库生态系统的营养状态[2]。本研究中,通过分析福建省11座不同营养状态水库的碳磷比、TN/TP与TLI的关系,发现DIC/TP、TN/TP与TLI均呈现显著的负相关关系。TN/TP在实践中作为描述浮游植物营养限制较为常用的指标之一[25],能够反映湖泊或水库的富营养化状态,但从实际解决水库富营养化问题出发,其并不适用于评价福建省的磷限制型水库。对亚热带湖泊进行研究,发现水体中,C是作为藻类和植物光合作用的关键因素,而且较高的CO2浓度/TP比值对调整浮游植物结构和改善营养状态有明显的作用[15]。本文从DIC/TP对表征营养状态的可能性角度进行探索,结果表明DIC/TP能较好地展现营养状态和藻细胞密度的变化趋势,这也应证了前期的研究结论[15]。从构建富营养化评价指标的合理性进行分析,DIC/TP指标将C、P营养元素进行结合,直观地体现出其对影响营养状态和藻类生物量的重要指示作用,符合营养状态评价方法构建的原则[15,26]。综上,DIC/TP有望创新成为一个富营养化评价的指标,但未来要提高其可适用性还需在更多的水库中进行实例验证,并建立完善的分级机制。
3.2 碳磷比对水体浮游植物生物量的影响
本研究通过对福建省11座不同营养状态水库的碳磷比及其相关性进行分析,发现不同空间上水库的碳磷比变化范围较大,其中DIC/TP值越低,水库富营养化越严重,这是因为水体富营养化使藻类大量繁殖,光合速率总是高于中营养和贫营养水体,而藻类在光合作用过程中消耗了更多的CO2,导致水库中DIC浓度较低[27-28]。同时,本研究结果显示富营养化水体中的DIC浓度相对TP浓度较低,可能与富营养化过程中的C、P循环机制和浮游植物的生长利用有关。例如,在对洱海湖泊[29]的研究中,富营养化湖泊存在2种养分控制模式,当N、P营养盐充足时,冬、春季的C限制作用大于P限制作用,夏、秋季的P限制作用大于C限制作用。这时由于CO2浓度会影响浮游植物的初级生产力,因此当浮游植物达到一定的生物量时,水体中CO2浓度会受到显著影响,即再次出现C限制作用。综上,水中C、P浓度对水中藻类生物量具有重要的影响。未来可在福建省亚热带水库不同季节DIC/TP对浮游植物初级生产力的作用、变化规律及与其他环境因子的相互作用等方面进行深入探讨。
4. 结论
本文研究了福建省11座水库的营养状态、浮游植物群落结构和营养元素碳磷比值特征,通过Pearson相关性分析,得到如下结果:
1)11座水库的TLI在35.9~54.4之间,10座水库(东溪水库、池潭水库、山美水库、东圳水库、棉花滩水库、东张水库、石兜水库、塘坂水库、坂头水库、山仔水库)处于中营养水平,官昌水库处于轻度富营养化水平。南平市东溪水库的营养程度最低,TLI值为35.1;宁德市官昌水库营养程度最高,TLI值为54.4。
2)11座水库共被检出浮游植物5门36属,其中绿藻门最多,为15属;蓝藻门为11属;硅藻门为7属;甲藻门为2属;隐藻门为1属。浮游植物密度范围为1.13×10⁶ ~5.77×10⁸ 个·L−1。蓝藻门在东张水库、东溪水库、塘坂水库、棉花滩水库、东圳水库、池潭水库、山仔水库、官昌水库8座水库中均为优势门类。
3)11座水库的DIC/TP值范围在17.4~402.6之间,其中宁德市官昌水库的DIC/TP值最低,为17.4;三明市池潭水库的DIC/TP值最高,达到402.6。DIC/TP与TLI、浮游植物密度均有显著的负相关关系。碳磷比对福建省水库浮游植物结构的影响有待进一步探究。
-
图 4 福建省11座水库碳磷比与综合营养状态指数(TLI)、浮游植物密度的相关性分析
注:*表示在 P<0.05(双尾)水平显著;**表示在 P<0.01(双尾)水平极显著。左下圆圈内数值表示相关性系数,圆圈颜色越深表示相关性越好。行、列均代表指标,横纵交叉表示行指标与列指标间的相关系数和显著水平。
Figure 4. Correlation analysis of carbon-phosphorus ratio with TLI and phytoplankton density of 11 reservoirs in Fujian Province
Notes: * indicates significan differences at P<0.05 (two tails) level; ** indicates extremely significant differences at P<0.01 (two tails) level. The values in the lower left circle represent the correlation coefficient. The darker the circle, the better the correlation. Rows and columns both represent indicators, and the crosses of horizontal and vertical represent the correlation coefficient and significance level between row indicators and column indicators.
表 1 水库分布信息
Table 1 Distribution information of the reservoirs
水库
Reservoirs所属城市
Cities经纬度
Latitude and longitude所属流域
Drainage basins总库容/×108 m³
Total storage capacity功能
Functions类别
Category棉花滩水库
Mianhuatan Reservoir龙岩 N24°40'44.22"、
E116°33'52.47"汀江流域 16.95 发电、防洪 大(1)型 池潭水库
Chitan Reservoir三明 N26°49'56.21"、
E117°02'22.20"闽江流域 8.70 发电、防洪 大(2)型 山美水库
Shanmei Reservoir泉州 N25°09'41.32"、
E118°25'21.28"晋江流域 6.55 灌溉、防洪、发电 大(2)型 东圳水库
Dongzhen Reservoir莆田 N25°29'02.46"、
E118°56'49.17"木兰溪流域 4.35 灌溉、防洪、发电 大(2)型 东张水库
Dongzhang Reservoir福州 N25°42'27.45"、
E119°15'57.47"龙江流域 2.06 供水、发电、灌溉 大(2)型 山仔水库
Shanzai Reservoir福州 N26°22'17.27"、
E119°18'30.15"敖江流域 1.72 供水、防洪、发电 大(2)型 东溪水库
Dongxi Reservoir南平 N27°47'43.75"、
E118°06'34.03"闽江流域 1.02 灌溉、发电 大(2)型 石兜水库
Shidou Reservoir厦门 N24°42'02.93"、
E118°00'39.20"后溪流域 0.61 供水 中型 官昌水库
Guanchang Reservoir宁德 N26°45'41.15"、
E119°28'44.58"七都溪流域 0.24 供水、灌溉 中型 塘坂水库
Tangban Reservoir福州 N26°17'46.15"、
E119°22'23.83"敖江流域 0.08 供水 小(1)型 坂头水库
Bantou Reservoir厦门 N24°40'38.30"、
E118°01'30.63"后溪流域 0.04 供水 小(1)型 表 2 福建省11座水库浮游植物门类鉴定结果
Table 2 Phytoplankton identification results of 11 reservoirs in Fujian Province
门 Phyla 属 Genera 绿藻门 Chlorophyta 小球藻属、衣藻属、卵囊藻属、栅藻属、十字藻属、新月藻属、鼓藻属、弓形藻属(Schroederia)、空球藻属( Eudorina )、四角藻属(Tetraedron )、顶棘藻属(Chodatella )、蹄形藻属(Hippodonta)、空星藻属(Coelastrum)、角星鼓藻属(Staurastrum)、盘藻属(Gonium) 蓝藻门 Cyanophyta 微囊藻属、颤藻属、色球藻属、螺旋藻属、假鱼腥藻属(Pseudanabaena)、束丝藻属(Aphanizomenon)、平裂藻属(Merismopedia)、鱼腥藻属(Anabaena)、尖头藻属(Raphidiopsis)、项圈藻属(Anabaenopsis)、细鞘丝藻属(Leptolyngbya) 硅藻门 Bacillariophyta 小环藻属、针杆藻属、直链藻属、舟形藻属、曲壳藻属(Achnanthes)、等片藻属(Diatoma)、舟形藻属(Navicula) 甲藻门 Pyrrophyta 角甲藻属、多甲藻属(Peridinium) 隐藻门 Cryptophyta 隐藻属 表 3 福建省11座水库浮游植物密度(×107个·L−1)
Table 3 Phytoplankton density of 11 reservoirs in Fujian Province (×107cells·L−1)
水库
Reservoirs山美水库
Shanmei Reservoir东张水库
Dongzhang Reservoir石兜水库
Shidou Reservoir东溪水库
Dongxi Reservoir坂头水库
Bantou Reservoir塘坂水库
Tangban Reservoir棉花滩水库
Mianhuatan Reservoir东圳水库
Dongzhen Reservoir池潭水库
Chitan Reservoir山仔水库
Shanmei Reservoir官昌水库
Guanchang Reservoir浮游植物密度
Phytoplankton density0.11 4.93 0.57 1.26 0.82 0.95 1.64 2.31 3.39 3.40 57.70 -
[1] 许海,陈洁,朱广伟,等. 水体氮、磷营养盐水平对蓝藻优势形成的影响[J]. 湖泊科学,2019,31(5):1239 − 1247. DOI: 10.18307/2019.0518 Xu H, Chen J, Zhu G W, et al. Effect of concentrations of phosphorus and nitrogen on the dominance of cyanobacteria[J]. Journal of Lake Sciences, 2019, 31(5): 1239 − 1247. DOI: 10.18307/2019.0518
[2] 宋子豪,邹伟,桂智凡,等. 我国常用湖泊营养状态指数研究进展与展望[J]. 湖泊科学,2024,36(4):987 − 1000. DOI: 10.18307/2024.0401 Song Z H, Zou W, Gui Z F, et al. Common-used trophic level index in Chinese lakes: progress and prospects[J]. Journal of Lake Sciences, 2024, 36(4): 987 − 1000. DOI: 10.18307/2024.0401
[3] Hammer K J, Kragh T, Sand-Jensen K. Inorganic carbon promotes photosynthesis, growth, and maximum biomass of phytoplankton in eutrophic water bodies[J]. Freshwater Biology, 2019, 64(11): 1956 − 1970. DOI: 10.1111/fwb.13385
[4] Bogard M J, Finlay K, Waiser M J, et al. Effects of experimental nitrogen fertilization on planktonic metabolism and CO2 flux in a hypereutrophic hardwater lake[J]. PLoS One, 2017, 12(12): e0188652. DOI: 10.1371/journal.pone.0188652
[5] Kilham S, Kreeger D, Goulden C, et al. Effects of nutrient limitation on biochemical constituents of Ankistrodesmus falcatus[J]. Freshwater Biology, 1997, 38(3): 591 − 596. DOI: 10.1046/j.1365-2427.1997.00231.x
[6] Verspagen J M H, Van De Waal D B, Finke J F, et al. Contrasting effects of rising CO2 on primary production and ecological stoichiometry at different nutrient levels[J]. Ecology Letters, 2014, 17(8): 951 − 960. DOI: 10.1111/ele.12298
[7] Verspagen J M H, Van De Waal D B, Finke J F, et al. Rising CO2 levels will intensify phytoplankton blooms in eutrophic and hypertrophic Lakes[J]. PLoS One, 2014, 9(8): e104325. DOI: 10.1371/journal.pone.0104325
[8] Spijkerman E, Maberly S C, Coesel P F M. Carbon acquisition mechanisms by planktonic desmids and their link to ecological distribution[J]. Canadian Journal of Botany, 2005, 83(7): 850 − 858. DOI: 10.1139/b05-069
[9] Vogt R J, St-Gelais N F, Bogard M J, et al. Surface water CO2 concentration influences phytoplankton production but not community composition across boreal lakes[J]. Ecology Letters, 2017, 20(11): 1395 − 1404. DOI: 10.1111/ele.12835
[10] Badger M R, Price G D. The role of carbonic anhydrase in photosynthesis[J]. Annual Reviews of Plant Biology, 1994, 45: 369 − 392. DOI: 10.1146/annurev.pp.45.060194.002101
[11] Low-Décarie E, Fussmann G F, Bell G. Aquatic primary production in a high-CO2 world[J]. Trends in Ecology & Evolution, 2014, 29(4): 223 − 232.
[12] Shapiro J. Blue-green algae: why they become dominant[J]. Science, 1973, 179(4071): 382 − 384. DOI: 10.1126/science.179.4071.382
[13] Low-Décarie E, Fussmann G F, Bell G. The effect of elevated CO2 on growth and competition in experimental phytoplankton communities[J]. Global Change Biology, 2011, 17(8): 2525 − 2535. DOI: 10.1111/j.1365-2486.2011.02402.x
[14] Liu Z H, Macpherson G L, Groves C, et al. Large and active CO2 uptake by coupled carbonate weathering[J]. Earth-Science Reviews, 2018, 182: 42 − 49. DOI: 10.1016/j.earscirev.2018.05.007
[15] Zhang Y, Liu Z H, Wu Y, et al. Relationships between biomass of phytoplankton and submerged macrophytes and physicochemical variables of water in Lake Caohai, China: implication for mitigation of cyanobacteria blooms by CO2 fertilization[J]. Journal of Hydrology, 2023, 617: 129111. DOI: 10.1016/j.jhydrol.2023.129111
[16] Ayub G, Su J Z, Su Y P, et al. A review of carbon and phosphorus ratios in fresh water ecosystems dominated by phytoplankton: effects of climate and geography[J]. Ecohydrology, 2024, 17(6): e2666. DOI: 10.1002/eco.2666
[17] 朱珍香,杨军. 福建水库空间分布特征:沿海密度高水量少、内陆密度低水量多[J]. 湖泊科学,2018,30(2):567 − 580. DOI: 10.18307/2018.0227 Zhu Z X, Yang J. The spatial distribution of reservoirs in Fujian Province: higher density but lower storage in coastal than inland regions[J]. Journal of Lake Sciences, 2018, 30(2): 567 − 580. DOI: 10.18307/2018.0227
[18] 中华人民共和国水利部. 水利水电工程等级划分及洪水标准:SL 252—2017[S]. 北京:中国水利水电出版社,2017:3. Ministry of Water Resources of the People’s Republic of China. Standard for rank classification and flood protection criteria of water and hydropower projects: SL 252—2017[S]. Beijing: China Water & Power Press, 2017: 3.
[19] Ding J T, Cao J L, Xu Q G, et al. Spatial heterogeneity of lake eutrophication caused by physiogeographic conditions: an analysis of 143 lakes in China[J]. Journal of Environmental Sciences, 2015, 30: 140 − 147. DOI: 10.1016/j.jes.2014.07.029
[20] 钟可儿,杨潇,马吉顺,等. 长江干流浮游植物群落结构空间异质性及其影响因素[J]. 长江流域资源与环境,2022,31(11):2458 − 2472. Zhong K E, Yang X, Ma J S, et al. Spatial heterogeneity and driving factors of phytoplankton community structure in the main stem of the Yangtze River[J]. Resources and Environment in the Yangtze Basin, 2022, 31(11): 2458 − 2472.
[21] 胡鸿钧,魏印心. 中国淡水藻类——系统、分类及生态[M]. 北京:科学出版社,2006. Hu H J, Wei Y X. The freshwater algae of China: systematics, taxonomy and ecology[M]. Beijing: Science Press, 2006.
[22] Zhang L J, Xue M, Wang M, et al. The spatiotemporal distribution of dissolved inorganic and organic carbon in the main stem of the Changjiang (Yangtze) River and the effect of the Three Gorges Reservoir[J]. Journal of Geophysical Research: Biogeosciences, 2014, 119(5): 741 − 757. DOI: 10.1002/2012JG002230
[23] 中华人民共和国水利部. 内陆水域浮游植物监测技术规程:SL 733—2016[S]. 北京:中国水利水电出版社,2016. Ministry of Water Resources of the People’s Republic of China. Technical code of phytoplankton monitoring in inland waters: SL 733—2016 [S]. Beijing: China Water & Power Press, 2016.
[24] 邹伟,朱广伟,蔡永久,等. 综合营养状态指数(TLI)在夏季长江中下游湖库评价中的局限及改进意见[J]. 湖泊科学,2020,32(1):36 − 47. DOI: 10.18307/2020.0104 Zou W, Zhu G W, Cai Y J, et al. The limitation of comprehensive trophic level index (TLI) in the eutrophication assessment of lakes along the middle and lower reaches of the Yangtze River during summer season and recommendation for its improvement[J]. Journal of Lake Sciences, 2020, 32(1): 36 − 47. DOI: 10.18307/2020.0104
[25] Phillips G, Pietiläinen O P, Carvalho L, et al. Chlorophyll-nutrient relationships of different lake types using a large European dataset[J]. Aquatic Ecology, 2008, 42(2): 213 − 226. DOI: 10.1007/s10452-008-9180-0
[26] 王志健,胡霞林,尹大强. 藻源有机质表征及消毒副产物生成潜能研究进展[J]. 环境化学,2021,40(10):2979 − 2991. DOI: 10.7524/j.issn.0254-6108.2021033001 Wang Z J, Hu X L, Yin D Q. Characterization and formation potential of disinfection by-products of algal organic matter: the critical review[J]. Environmental Chemistry, 2021, 40(10): 2979 − 2991. DOI: 10.7524/j.issn.0254-6108.2021033001
[27] Song K S, Wen Z D, Xu Y J, et al. Dissolved carbon in a large variety of lakes across five limnetic regions in China[J]. Journal of Hydrology, 2018, 563: 143 − 154. DOI: 10.1016/j.jhydrol.2018.05.072
[28] 肖秋梦,郑志宏,李林. 江西省鄱阳县典型湖泊浮游植物群落结构变化及分析[J]. 江西水利科技,2024,50(1):22 − 30. DOI: 10.3969/j.issn.1004-4701.2024.01-04 Xiao Q M, Zheng Z H, Li L. Changes in phytoplankton community structure in typical lakes of Poyang County of Jiangxi Province[J]. Jiangxi Hydraulic Science & Technology, 2024, 50(1): 22 − 30. DOI: 10.3969/j.issn.1004-4701.2024.01-04
[29] Lai C W, Ma Z, Liu Z H, et al. Alleviating eutrophication by reducing the abundance of Cyanophyta due to dissolved inorganic carbon fertilization: insights from Erhai Lake, China[J]. Journal of Environmental Sciences, 2023, 131: 68 − 83. DOI: 10.1016/j.jes.2022.10.030


 下载:
下载:
